- September 28, 2023
- Posted by: capadmin
- Category: Market News
Bearish Whispers: A Deep Dive into USDCAD 4h
Diving into the USDCAD’s 4h chart, it’s clear we’re surfing a wave of shifting momentum. With pivotal crosses and intriguing RSI tales, here’s what the indicators are whispering about the pair’s next move.
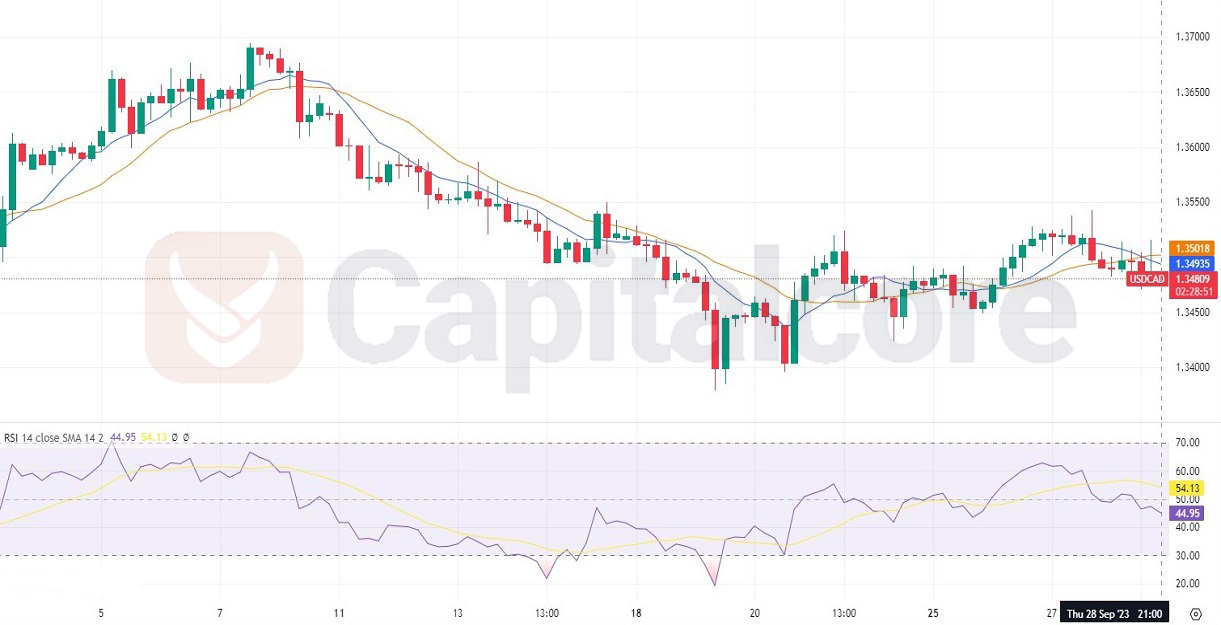
Chart Notes:
• Chart time-zone is UTC (+03:00)
• Candles’ time-frame is 4h.
Bearish tendencies are evident in the recent technical setup. The RSI reading of 44.95, although not oversold, is tilting toward the bearish territory and is diverging from its RSI-based MA, which is currently at 54.13. This suggests a weakening of recent bullish momentum. Further accentuating this sentiment is the short-term SMA crossing below the long-term SMA, often considered a ‘death cross,’ indicating potential downward price movement ahead. In light of these combined signals, we might expect further bearish pressure on the USDCAD pair in the short term. However, traders should always consult multiple indicators and employ sound risk management strategies when making trading decisions.
• DISCLAIMER: Please note that the above analysis is not an investment suggestion by “Capitalcore Ltd”. This post has been published only for educational purposes.