- November 30, 2023
- Posted by: capadmin
- Category: Market News
USD/CAD 4H Chart: Bears in Control, For Now
The USD/CAD currency pair, commonly known as the “Loonie,” is a significant gauge of economic interaction between the United States and Canada, reflecting the balance of trade and investment between these neighboring economies. It is a bellwether for traders looking to capitalize on fluctuations in commodity prices, particularly oil, which is a major Canadian export and can significantly influence the value of the Canadian dollar. The pair’s volatility is often affected by both U.S. and Canadian economic reports, as well as global geopolitical events, making it a dynamic instrument in the foreign exchange market.
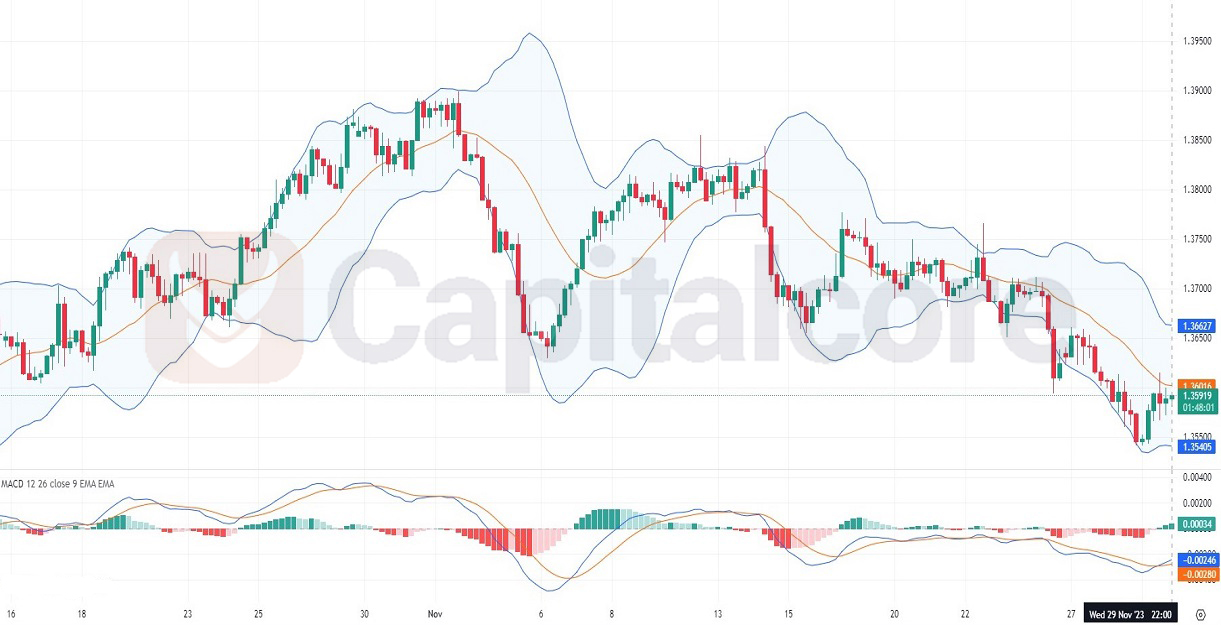
Chart Notes:
• Chart time-zone is UTC (+03:00)
• Candles’ time-frame is 4h.
Based on the 4-hour chart for USD/CAD, the pair has been experiencing a downtrend, as indicated by the consistent lower highs and lower lows. The Bollinger Bands are widening, suggesting increased market volatility, and the pair is trading near the lower band, which could indicate oversold conditions. The MACD is below the signal line and has been descending, which supports the bearish momentum. However, the recent green candles suggest a potential short-term pullback. The Moving Average lines show a bearish crossover with the short-term moving average below the long-term average, reinforcing the downtrend. Traders might look for the MACD to potentially cross back above the signal line or for the price to break above the moving averages before considering a reversal.
• DISCLAIMER: Please note that the above analysis is not an investment suggestion by “Capitalcore Ltd”. This post has been published only for educational purposes.