- January 3, 2024
- Posted by: capadmin
- Category: Market News
Navigating Bullish Currents with an Eye on Potential Reversals
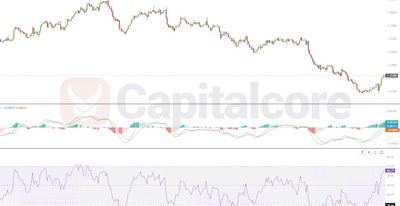
On the H4 chart for USDCAD, the RSI reading of 65% indicates that the pair is approaching overbought territory, but it is not there yet. This suggests that there is still bullish momentum in the market, with buyers exerting pressure. However, traders should be cautious as an RSI nearing 70% could signal potential for a reversal if buyers begin to exhaust their strength and sellers take control. Monitoring the RSI for any signs of divergence from price action could provide early warnings of a shift in the market sentiment.

Chart Notes:
• Chart time-zone is UTC (+03:00)
• Candles’ time-frame is 4h.
The MACD histogram’s green bars demonstrate positive momentum, indicating that the short-term trend is bullish as the market moves higher. The fact that both the MACD and signal lines are below the histogram could imply that although the trend is upwards, there may be a slowdown in the momentum since the histogram is leading the indicator lines. This configuration often warrants attention as it might precede a crossover of the MACD line over the signal line, which could be a bearish signal. Traders may want to look for confirmation from other indicators or chart patterns to validate any potential trend changes suggested by the MACD’s position relative to the histogram..
• DISCLAIMER: Please note that the above analysis is not an investment suggestion by “Capitalcore Ltd”. This post has been published only for educational purposes.