- April 18, 2024
- Posted by: capadmin
- Category: Market News
Decoding USDCAD: Ichimoku and MACD Signals
The USDCAD pair, commonly known as the “Loonie,” is a major forex pair that represents the exchange rate between the US Dollar and the Canadian Dollar. It is an important gauge of the two economies, heavily influenced by trade relations, oil price fluctuations, and shifts in monetary policy from the Federal Reserve and the Bank of Canada.

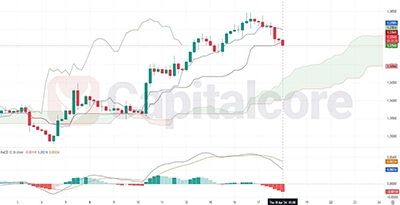
Chart Notes:
• Chart time-zone is UTC (+03:00)
• Candles’ time-frame is 4h.
In the H4 timeframe for USDCAD, the Ichimoku Cloud is starting to indicate a potential shift in momentum. Price action has moved below the cloud, which suggests a bearish outlook as the market sentiment turns cautious. The recent candlesticks have closed under the baseline (Kijun-sen), reinforcing the bearish scenario. However, the conversion line (Tenkan-sen) has not yet crossed below the baseline, which would provide a stronger sell signal. The Leading Span A (Senkou Span A) is also starting to edge downward, anticipating potential resistance ahead. The MACD indicator shows the signal line crossing below the MACD line, confirming the bearish momentum seen in price action. Histogram bars are growing on the downside, indicating an increase in bearish pressure. As of the last candle on the chart, there is no clear sign of divergence that could suggest a reversal; thus, the bearish trend may continue. Traders should watch for the potential resistance formed by the cloud if a pullback occurs. The next few candlesticks will be crucial to determine if the bearish momentum will persist or if a reversal is imminent.
• DISCLAIMER: Please note that the above analysis is not an investment suggestion by “Capitalcore Ltd”. This post has been published only for educational purposes.