- August 24, 2023
- Posted by: Lewis Miller
- Category: Market News

USDCAD Movement: Reading Between the Lines
The USDCAD currency pair is presenting noteworthy technical patterns. Tools like the Relative Strength Index (RSI) and Simple Moving Averages (SMAs) hint at potential future movements. Let’s explore these indicators further.

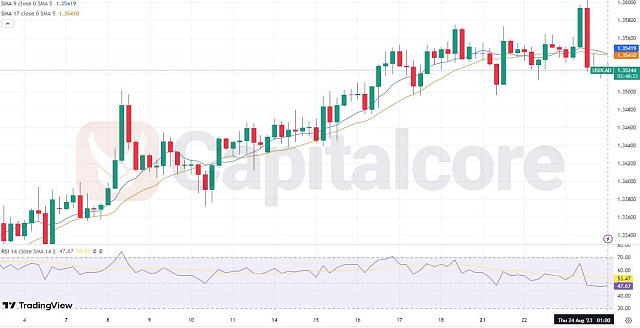
Chart Notes:
• Chart time-zone is UTC (+03:00)
• Candles’ time-frame is 4h.
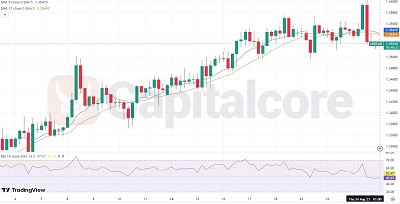
The USDCAD currency pair appears to be in a transitional phase. The Relative Strength Index (RSI) reading of 47.67 suggests that the pair is approaching a neutral territory, neither being in the oversold nor the overbought region. The RSI-Based Moving Average at 53.47 indicates that the recent momentum has been slightly on the bullish side. Most notably, the short-term Simple Moving Average (SMA) crossing above the long-term SMA is a classic bullish signal, commonly referred to as a “golden cross.” However, since the short SMA is moving very close to the long SMA, traders should be cautious. It indicates potential volatility and uncertainty in the near future. Overall, while there are bullish signs, caution is advised given the close proximity of the SMA lines.
• DISCLAIMER: Please note that the above analysis is not an investment suggestion by “Capitalcore Ltd”. This post has been published only for educational purposes.