- December 11, 2023
- Posted by: capadmin
- Category: Market News
USDCHF: Potential Reversal Above the Cloud
The USDCHF pair, often termed as the “Swissie,” represents the currency exchange rate between the U.S. Dollar and the Swiss Franc. As a pairing that denotes strength and stability, it serves as a significant indicator of global economic health. The following technical analysis delves into the current price action and technical indicators to forecast potential market movements.
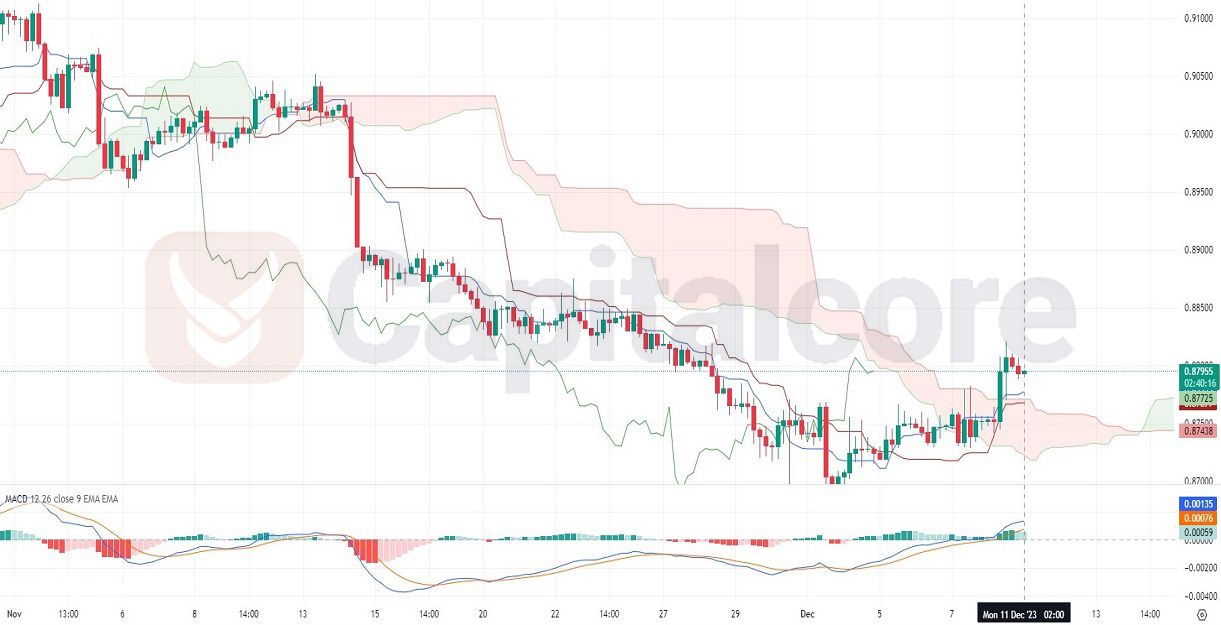
Chart Notes:
• Chart time-zone is UTC (+03:00)
• Candles’ time-frame is 4h.
The USDCHF chart presents a fluctuating dynamic within a clearly defined Ichimoku Cloud, indicating a market in transition. The recent price action has breached above the Ichimoku Cloud, suggesting a potential shift from bearish to bullish sentiment. The Tenkan-sen (blue line) appears to be crossing above the Kijun-sen (red line), typically a bullish signal. However, the Chikou Span (green line) still lingers below the price, hinting at underlying bearish pressure. The MACD histogram shows increasing bullish momentum, with the MACD line trending upwards away from the signal line. The Relative Strength Index (RSI) is not visible, leaving us to rely on the observed price action and the Ichimoku elements for directional cues. Support seems to be forming near the 0.87200 level, while resistance is likely being tested at the recent highs around 0.88255.
• DISCLAIMER: Please note that the above analysis is not an investment suggestion by “Capitalcore Ltd”. This post has been published only for educational purposes.