- June 4, 2024
- Posted by: james w
- Category: Market News
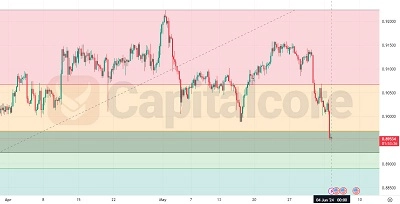
USDCHF: Economic News Impact and Price Trends
The USDCHF currency pair, representing the exchange rate between the US Dollar and the Swiss Franc, is currently at a critical juncture. The price line is on an important support level, and if it breaks below this point, the bears will have a significant opportunity to dominate. The candle pattern also appears bearish, increasing the likelihood that the price will fall below this support level. Recent economic news affecting the USD includes the Final Manufacturing PMI at 51.3, ISM Manufacturing PMI at 48.7, ISM Manufacturing Prices at 57.0, Construction Spending m/m at -0.1%, and Wards Total Vehicle Sales at 15.9M. These mixed reports indicate potential weaknesses in the manufacturing sector but show resilience in consumer spending on durable goods.

Chart Notes:
• Chart time-zone is UTC (+03:00)
• Candles’ time-frame is 4h.
In this context, the price action analysis on USDCHF is crucial. The support level being tested is a significant barrier. If the price breaks below this level, it would likely signal further bearish momentum, consistent with the observed bearish candle pattern. Traders should closely monitor this support level for any signs of a breakdown, which could provide opportunities for short positions. Conversely, a bounce from this support could indicate a potential reversal, offering opportunities for long positions. Stay updated with the USDCHF live analysis, dollar forecast against Swiss Franc, and USDCHF price prediction for today.