- February 5, 2024
- Posted by: capadmin
- Category: Market News
USDCHF’s Sharp Reversal: A Technical Insight
The USDCHF currency pair, also known as the “Swissie,” reflects the relationship between the US Dollar and the Swiss Franc and is often sought by traders for its stability and liquidity. The pair’s movement is influenced by the monetary policies of the Federal Reserve and the Swiss National Bank, as well as the broader economic indicators from both countries.
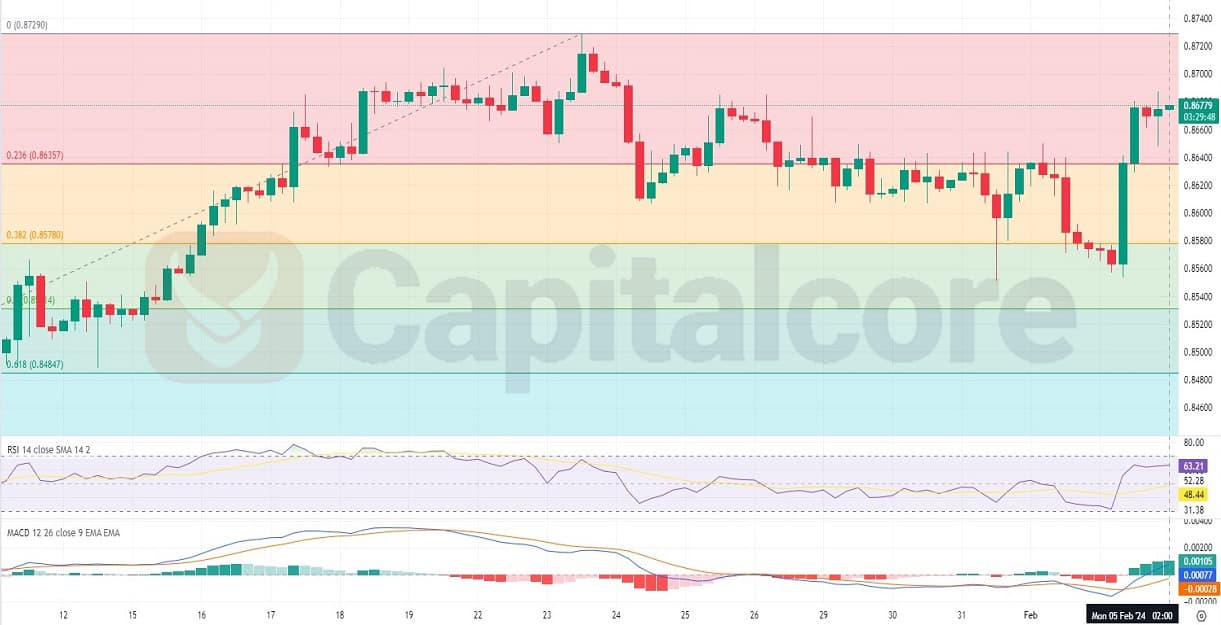
Chart Notes:
• Chart time-zone is UTC (+03:00)
• Candles’ time-frame is 4h.
On the H4 chart of USDCHF, the market has shown a sharp reversal off the Fibonacci 0.618 retracement level, indicating a strong area of resistance. The RSI indicator is at 63.21, suggesting a growing bullish momentum without yet reaching the overbought threshold. Meanwhile, the MACD histogram is ticking higher above its signal line, reinforcing the bullish sentiment. The recent price action has broken past the 0.236 Fibonacci level at 0.86357, which could now act as a support in the near term. This bullish sentiment, if sustained, may push prices towards testing the next significant resistance level at the 0.87290 Fibonacci retracement. Traders might look for potential retracement or consolidation as the market processes the recent sharp movement. Risk management will be crucial, as the pair approaches overbought conditions that could precede a pullback.
• DISCLAIMER: Please note that the above analysis is not an investment suggestion by “Capitalcore Ltd”. This post has been published only for educational purposes.