- October 18, 2023
- Posted by: capadmin
- Category: Market News
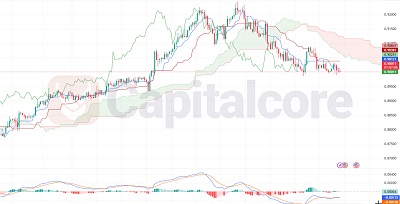
USDCHF Treads Bearish Path on T4H.
The USDCHF on the 4-hour chart is showing bearish indications according to the Ichimoku Kinko Hyo system. The most recent cloud (Kumo) is red, suggesting a potential downtrend. This is further reinforced by the fact that the price candles are positioned below the cloud, indicating that the pair is trading in negative territory. The base line appears to be ranging, suggesting uncertainty or consolidation, while the conversion line (Tenkan-sen) aligns with the candles, indicating a possibly volatile equilibrium between buyers and sellers.

Chart Notes:
• Chart time-zone is UTC (+03:00)
• Candles’ time-frame is 4h.
The MACD indicator reinforces this bearish sentiment. Both the MACD line and the signal line are positioned below the histogram. This typically suggests that the bearish momentum is in control. Given these technical cues, we can expect the USDCHF market to possibly continue its downward movement, or at least maintain its bearish bias in the short term, unless we witness significant bullish reversals.
• DISCLAIMER: Please note that the above analysis is not an investment suggestion by “Capitalcore Ltd”. This post has been published only for educational purposes.