- September 26, 2023
- Posted by: capadmin
- Category: Market News
USD/JPY: Using Ichi Moku and RSI Indicator
The USD/JPY currency pair demonstrates a bullish sentiment as evidenced by the recent Ichimoku indicator patterns. Notably, the candles are trading above the cloud, signaling an ongoing uptrend. The last cloud, presented in a dominant green shade, further indicates bullish momentum. Additionally, both the conversion line and the base line, being positioned below the candles, emphasize the upward trajectory that the currency pair seems to be following. This is indicative of buying pressure and might suggest further upside potential in the near term.
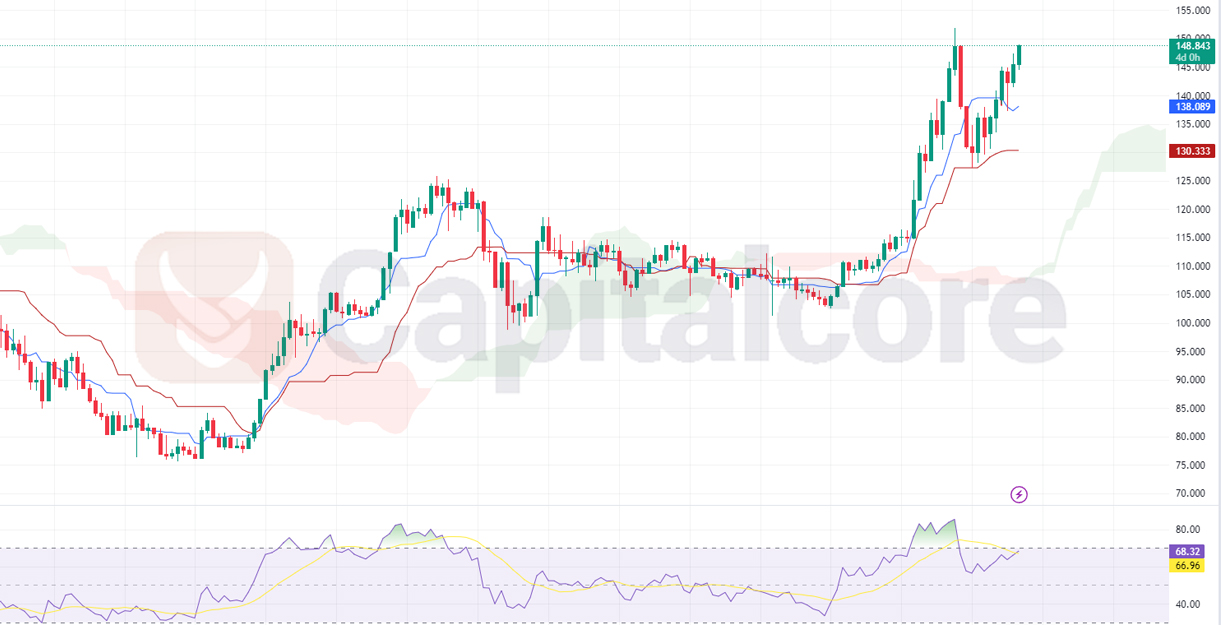
Chart Notes:
• Chart time-zone is UTC (+03:00)
• Candles’ time-frame is 4h.
In complement to the Ichimoku, the Relative Strength Index (RSI) for USD/JPY is presently hovering around the 68 mark. This value is close to the overbought threshold of 70, hinting that the market might be stretching towards an overbought condition. While the RSI level suggests strong buying momentum, traders should be cautious as readings near or above 70 often signal a potential pullback or consolidation in the future. Integrating both the Ichimoku and RSI insights, while the pair seems to be in a bullish phase, nearing overbought territories might invite some volatility or a short-term reversal.
• DISCLAIMER: Please note that the above analysis is not an investment suggestion by “Capitalcore Ltd”. This post has been published only for educational purposes.