- December 5, 2023
- Posted by: capadmin
- Category: Market News
“USDJPY MACD Indicator: Caution Needed”
Analysis of USDJPY using the Ichimoku indicator reveals a bearish sentiment. The last cloud in the Ichimoku chart is red, indicating a downtrend. Additionally, both the conversion line and base line are positioned below the candlesticks, further reinforcing the bearish outlook. This suggests that the selling pressure is prevailing, making it a challenging environment for USDJPY bulls.
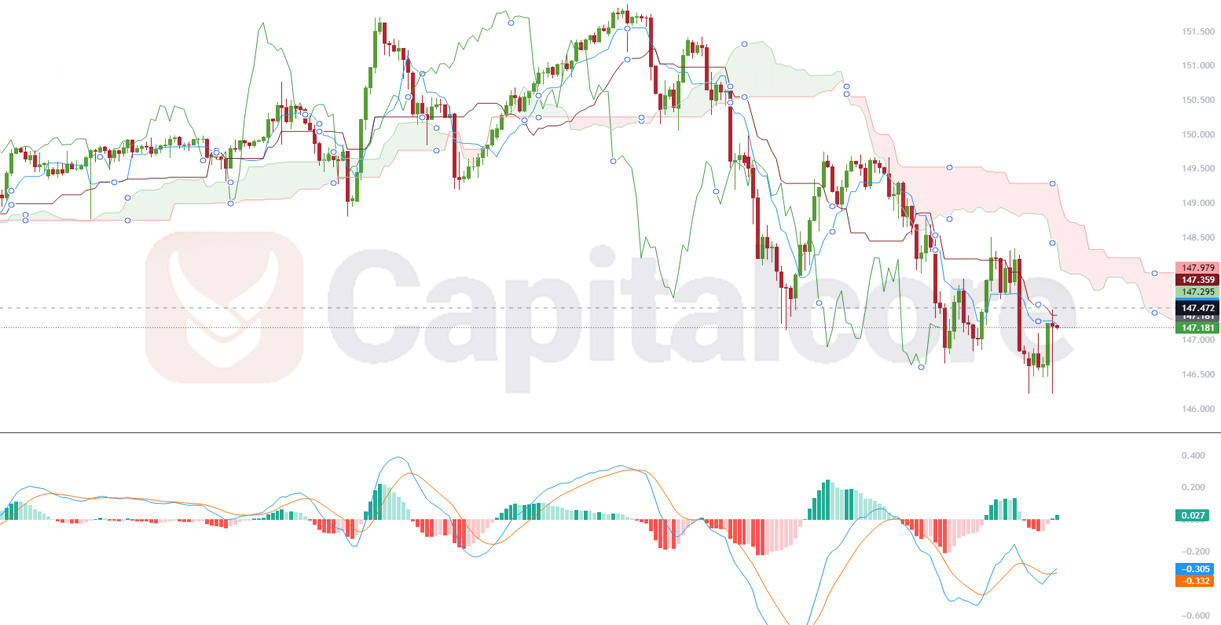
Chart Notes:
• Chart time-zone is UTC (+03:00)
• Candles’ time-frame is 4h.
On the other hand, when observing the MACD indicator, the histogram is green, signaling some upward momentum. However, both MACD lines remain below the histogram, indicating that this bullish momentum may be weak and could potentially be short-lived. Traders should exercise caution and closely monitor price movements for potential reversal signals, given the conflicting signals between the Ichimoku cloud and the MACD histogram.
• DISCLAIMER: Please note that the above analysis is not an investment suggestion by “Capitalcore Ltd”. This post has been published only for educational purposes.