- September 8, 2023
- Posted by: capadmin
- Category: Market News
USDJPY’s Bearish Dance: What’s Next?
The USDJPY, a major forex pair representing the US dollar and Japanese yen, often serves as a barometer for East-West economic dynamics. Let’s delve into its recent performance and potential future movements.
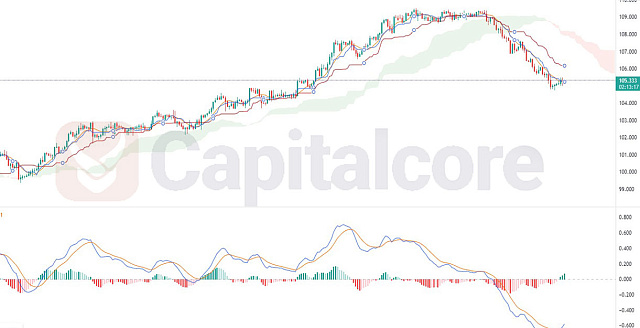
Chart Notes:
• Chart time-zone is UTC (+03:00)
• Candles’ time-frame is 4h.
On the 4-hour USDJPY chart, bearish signals are emerging. The short-term Simple Moving Average (SMA) has crossed below the longer-term SMA, often indicating potential downward momentum. Further corroborating this bearish outlook is the MACD line crossing below the signal line. While the MACD’s histogram reading at 0.188 is not deeply negative, its position below zero confirms the bearish sentiment. Given these technical cues, we may anticipate a further decline in the USDJPY pair in the short term. As always, traders should remain vigilant to changing market conditions and incorporate other analytical methods and risk management strategies before making decisions.
• DISCLAIMER: Please note that the above analysis is not an investment suggestion by “Capitalcore Ltd”. This post has been published only for educational purposes.