- October 2, 2023
- Posted by: capadmin
- Category: Market News

Unpacking the USDNZD’s Latest Moves
The USDNZD 4-hour chart presents a confluence of intriguing technical signals, indicating a potential turning point or continuation for the pair. As traders scrutinize the interplay between key technical indicators, a clearer picture of the pair’s trajectory emerges. Let’s delve into the specifics of what these signals are suggesting.
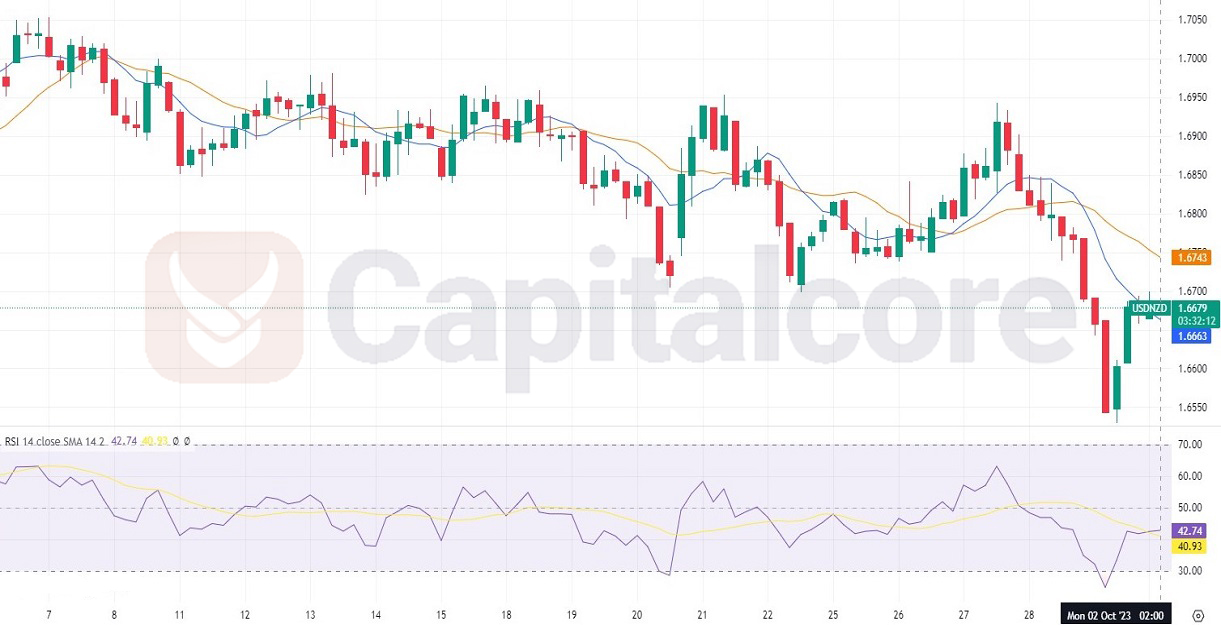
Chart Notes:
• Chart time-zone is UTC (+03:00)
• Candles’ time-frame is 4h.
On the 4-hour chart for USDNZD, the technical landscape points to a mixed momentum. The short-term SMA has moved below the long-term SMA, a potential bearish indication suggesting that prices could be moving lower. This might hint at an emerging downtrend or a continuation of an existing one. However, the RSI, currently at 42.74, has crossed above its RSI-based moving average at 40.93, which can be a sign of bullish momentum. This RSI movement might indicate a possible reversal or a short-term uptick in price. Given these conflicting indicators, traders should approach with caution and perhaps look for additional confirmation from other technical or fundamental signals before making any trading decisions.
• DISCLAIMER: Please note that the above analysis is not an investment suggestion by “Capitalcore Ltd”. This post has been published only for educational purposes.