- July 26, 2023
- Posted by: Lewis Miller
- Category: Market News
GBPUSD Faces Potential Downtrend: SMA Cross and RSI Review
In this analysis, we explore GBPUSD’s market dynamics, focusing on key technical indicators. We assess the SMA crossover’s impact on the short-term trend and analyze the RSI and its Moving Average for overall sentiment evaluation. Traders and investors can use this information to make more informed decisions.
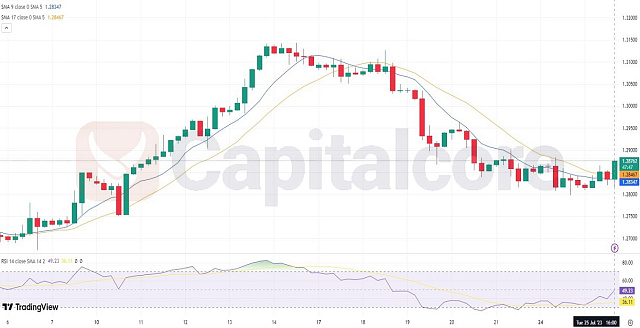
Chart Notes:
• Chart time-zone is UTC (+03:00)
• Candles’ time-frame is 4h.
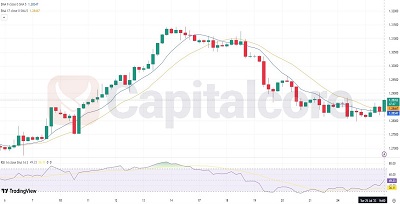
The GBPUSD currency pair is currently displaying a potential bearish signal. The Simple Moving Average (SMA) short line has recently crossed below the SMA long line, and the proximity between the two suggests a strengthening bearish momentum. Alongside this, the Relative Strength Index (RSI) is reading 49.99, indicating a relatively neutral sentiment, while the RSI-based Moving Average (MA) is at 40.06, hinting at a mild bearish bias.
The combination of the SMA crossover and the RSI-based MA provides traders with cautious insight into a possible downward trend. However, it is essential to consider other technical and fundamental factors before forming a definitive trading strategy.
• DISCLAIMER: Please note that the above analysis is not an investment suggestion by “Capitalcore Ltd”. This post has been published only for educational purposes.