- July 25, 2023
- Posted by: Lewis Miller
- Category: Market News
Navigating Gold’s Technical Terrain: An Analytical Perspective
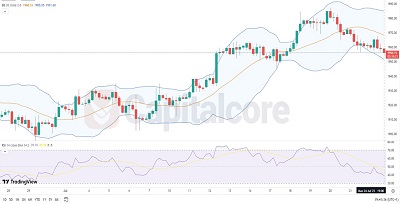
Recent technical signals in Gold trading indicate a possible shift in market dynamics. The RSI’s drop from above 70 to 38 suggests a weakening uptrend while widening Bollinger Bands hint at increased volatility and potential breakout opportunities. Long shadows on recent candles add to market uncertainty and indecision. Traders should closely monitor price movements to determine the future direction of Gold and adjust their strategies accordingly.
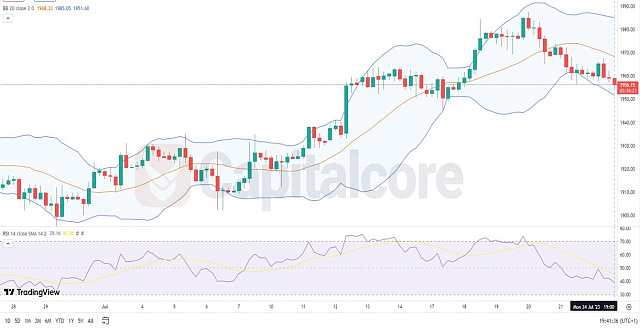
Chart Notes:
• Chart time-zone is UTC (+03:00)
• Candles’ time-frame is 4h.
Gold seems to be experiencing a potential shift in momentum as indicated by technical signals. The RSI dropping from above 70 to 38 suggests a decline in overbought conditions, possibly indicating a pause in the uptrend or even a bearish reversal. Concurrently, the widening Bollinger Bands imply increased volatility and a potential breakout. The presence of long shadows on recent candles indicates uncertainty and possible indecision in the market. Traders should closely monitor price movements to determine whether Gold may continue its upward trajectory or if a corrective phase is underway. Prudent risk management strategies are vital in this situation to adapt to changing market dynamics.
• DISCLAIMER: Please note that the above analysis is not an investment suggestion by “Capitalcore Ltd”. This post has been published only for educational purposes.