- August 14, 2023
- Posted by: Lewis Miller
- Category: Market News
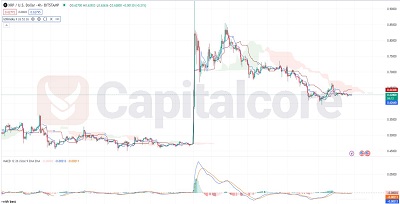
XRPUSD: Cloud and Candles
The XRPUSD (Ripple to USD) analysis reveals a potentially bullish outlook as indicated by the green Ichimoku Cloud, suggesting a shift from a bearish trend. However, the red MACD histogram candles hint at possible bearish divergence, indicating caution. Traders should consider these mixed signals alongside other factors before making trading decisions.
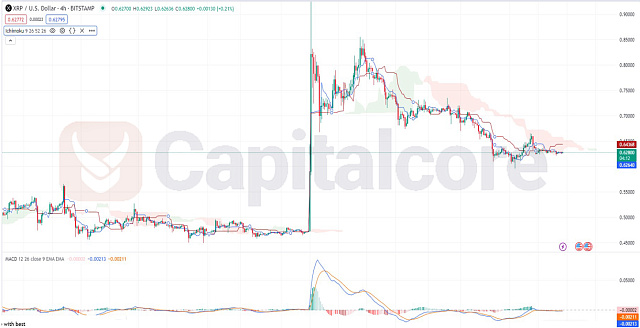
Chart Notes:
• Chart time-zone is UTC (+03:00)
• Candles’ time-frame is 4h.
Furthermore, the positioning of the Base Line above the Conversion Line, a bearish indication in the Ichimoku system, adds to the cautious outlook. This configuration suggests a potential continuation of downward pressure, possibly limiting the immediate bullish potential. The MACD (Moving Average Convergence Divergence) analysis further underscores the bearish sentiment. Both the MACD line and the Signal line align with the red histogram candles, indicating potential downward momentum. This alignment suggests that the bearish pressure might intensify in the near future, warranting careful consideration for traders looking to navigate this market. Considering these factors, traders should approach the XRPUUSD pair with caution, as the mixed signals from Ichimoku and the bearish alignment in the MACD histogram point to a market that is currently favoring the bearish side.
• DISCLAIMER: Please note that the above analysis is not an investment suggestion by “Capitalcore Ltd”. This post has been published only for educational purposes.