- September 5, 2023
- Posted by: capadmin
- Category: Market News
Unpacking XRPUSD: Indicators Amidst Stagnant Prices
The XRPUSD market is currently marked by a period of limited price movement, reflecting a sideways momentum. Observations of the gradually increasing Relative Strength Index (RSI) and the MACD histogram hovering around zero suggest potential shifts in momentum and direction on the horizon.
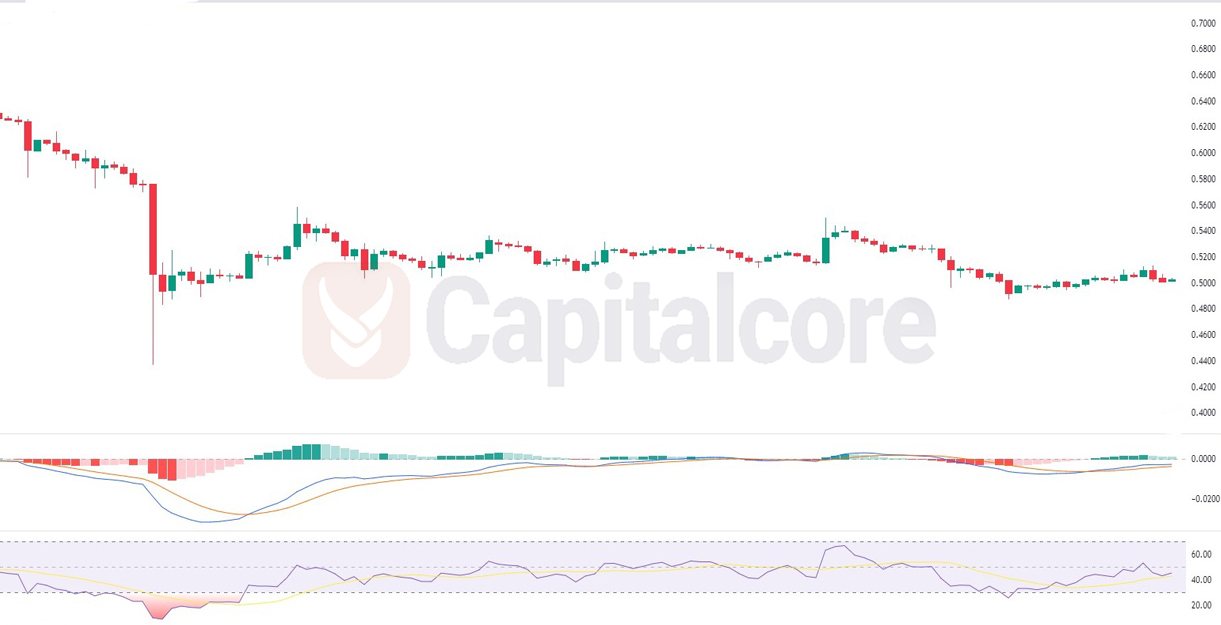
Chart Notes:
• Chart time-zone is UTC (+03:00)
• Candles’ time-frame is 4h.
The XRPUSD market has been experiencing a period of sideways momentum with no significant price movements. This consolidation phase is characterized by a lack of clear trend direction. The Relative Strength Index (RSI) has shown a gradual increase, indicating a potential buildup of buying interest despite the lack of major price changes. On the other hand, the histogram on the Moving Average Convergence Divergence (MACD) indicator has been hovering around the zero line, suggesting a balance between bullish and bearish momentum. Traders may be watching for a breakout from this sideways range, as the increasing RSI and the MACD histogram near zero indicate the potential for a shift in momentum and direction in the near future.
• DISCLAIMER: Please note that the above analysis is not an investment suggestion by “Capitalcore Ltd”. This post has been published only for educational purposes.