- April 19, 2024
- Posted by: capadmin
- Category: Market News
XRPUSD Technical Outlook: The Ichimoku Cloud Perspective
In the realm of cryptocurrency trading, technical analysis serves as a compass for navigating market trends and sentiment. The XRPUSD pair, a popular instrument in the crypto market, presents unique opportunities and challenges for traders. The H4 chart offers a window into the current state of Ripple (XRP) against the US Dollar, and through the lens of technical indicators like Ichimoku clouds, RSI, and Fibonacci levels, we can glean valuable insights.

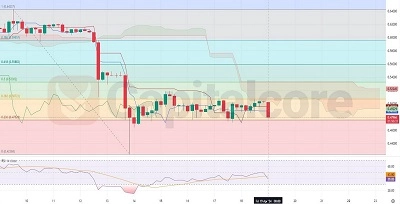
Chart Notes:
• Chart time-zone is UTC (+03:00)
• Candles’ time-frame is 4h.
The H4 chart for XRPUSD suggests a market grappling with direction as it maneuvers within the Ichimoku cloud, indicating a zone of uncertainty with potential for either trend continuation or reversal. The RSI, hovering below the 50 mark, leans towards a bearish momentum, hinting that sellers might still have some control. The price is currently oscillating around the 0.5 Fibonacci retracement level, which often acts as a pivotal point for future price movements. A break above this level could attract bullish interest, but failure to do so may see XRPUSD testing the 0.618 retracement at around $0.55883, which could serve as the next support. The Ichimoku cloud’s twist could also foreshadow changing market dynamics, but with the cloud’s borders acting as immediate support and resistance zones, traders should monitor these boundaries closely for potential breakouts or bounces.
• DISCLAIMER: Please note that the above analysis is not an investment suggestion by “Capitalcore Ltd”. This post has been published only for educational purposes.