- August 10, 2023
- Posted by: Lewis Miller
- Category: Market News

Emerging Bullish Trend in XRPUSD
The XRPUSD analysis presents an emerging scenario marked by the start of a bullish momentum following a recent price decline. With the RSI hovering close to 70, indicating heightened buying interest, and the MACD histogram’s green bars gaining strength, there are indications of potential upward movement. However, a cautious approach is advised, considering the possibility of overbought conditions and the need for sustained bullish confirmation.
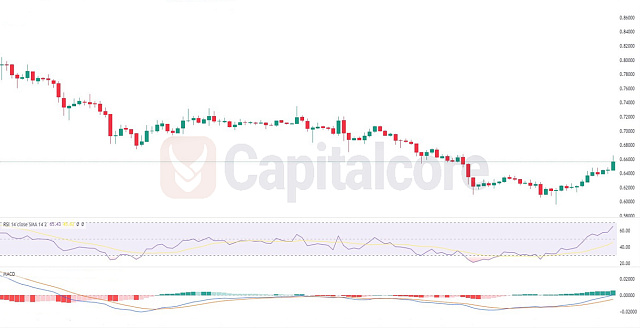
Chart Notes:
• Chart time-zone is UTC (+03:00)
• Candles’ time-frame is 4h.
The XRPUSD analysis reveals an intriguing setup. Following a price decline, the candles are displaying signs of a potential bullish momentum initiation. The RSI nearing 70 suggests a bullish sentiment with possible overbought conditions, indicating increased buying pressure. The MACD histogram’s green bars gaining strength indicate a shift in favor of upward movement. However, traders should remain cautious, as overextension might lead to a pullback. Monitoring for confirmation through sustained bullish candle patterns and considering possible resistance levels is essential before making trading decisions in this context.
• DISCLAIMER: Please note that the above analysis is not an investment suggestion by “Capitalcore Ltd”. This post has been published only for educational purposes.