- April 10, 2024
- Posted by: capadmin
- Category: Market News
Navigating the Shifts
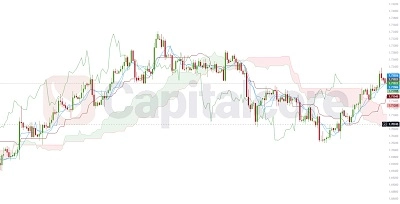
The GBPCAD pair on the 4-hour timeframe demonstrates a dynamic trend, with the recent price movement suggesting a shift in momentum. Observing the Ichimoku Cloud setup, the price has pierced through and settled above the cloud, which often indicates a transition from a downtrend to an uptrend. The price positioning above both the cloud and the blue Kijun-sen line further solidifies this bullish outlook. Additionally, the green Chikou Span is positioned above the price action and the cloud, reinforcing the potential for continued upward movement.

Chart Notes:
• Chart time-zone is UTC (+03:00)
• Candles’ time-frame is 4h.
Incorporating the Moving Average, the price is currently above the MA, which typically acts as a dynamic support in an uptrend. This position above the MA provides a bullish confirmation in conjunction with the Ichimoku Cloud’s signals. As the price sustains above the MA, it shows that the bullish sentiment is prevalent among traders. However, traders should be mindful of the MA slope; a flattening or downturn could signal weakening momentum. Resistance might be encountered near past price peaks, and any pullbacks could test the MA as a support level. To navigate this trend effectively, traders should consider the interplay of price action with the Moving Average and Ichimoku indicators, keeping an eye out for any fundamental factors that may affect the Sterling and the Loonie.
• DISCLAIMER: Please note that the above analysis is not an investment suggestion by “Capitalcore Ltd”. This post has been published only for educational purposes.