- April 9, 2024
- Posted by: capadmin
- Category: Market News
Deciphering XRPUSD’s Technical Dance
The XRPUSD pair on the 4-hour timeframe demonstrates a somewhat volatile market environment, as indicated by the width of the Bollinger Bands. The recent price action has the market oscillating around the middle band, signifying an ongoing tussle between bullish and bearish sentiment. The Bollinger Bands also suggest increased market volatility with potential for rapid price movements, as the bands are not in a tight squeeze. Notably, there is a consistent pattern of sharp moves followed by consolidation, implying that traders are reacting to immediate stimuli, potentially news-driven or sentiment-based, which then gets absorbed as the market digests the information.
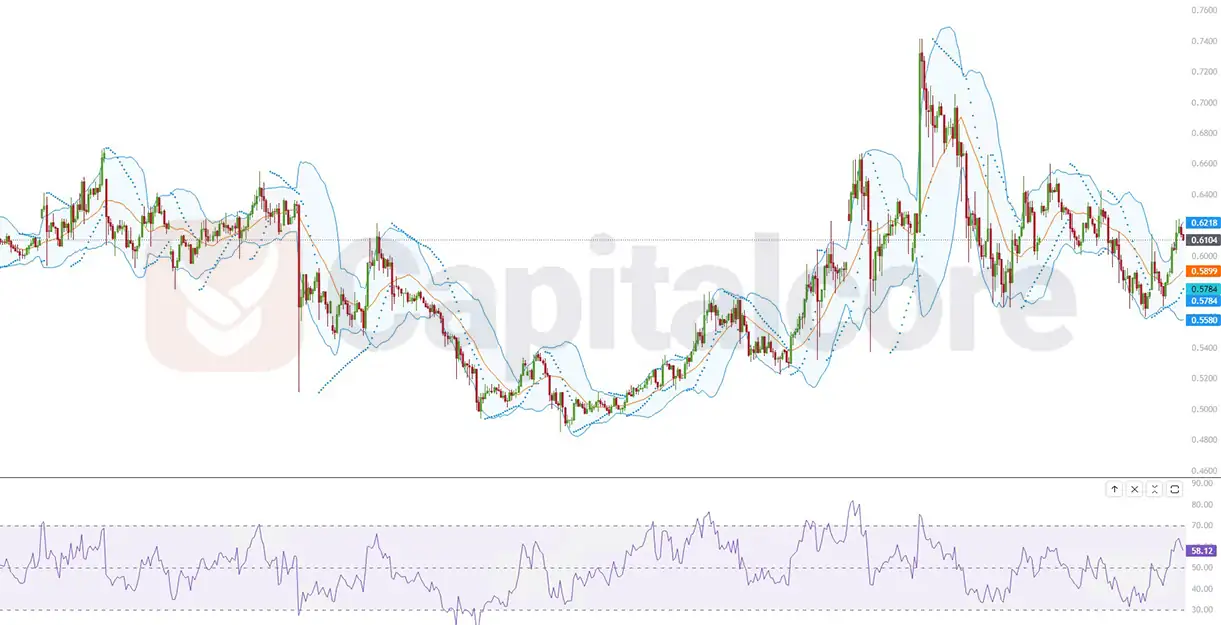
Chart Notes:
• Chart time-zone is UTC (+03:00)
• Candles’ time-frame is 4h.
From a technical perspective, the RSI (Relative Strength Index) is currently hovering around the 58 mark, which leans toward neither an overbought nor oversold condition, granting a neutral standpoint for the pair at this moment. The RSI’s position reflects a balance between buying and selling pressures but also indicates that the market has the potential to swing either way without much resistance from extreme sentiment. The Parabolic SAR dots have recently flipped above the price, which typically signals a bearish trend reversal; however, since they are quite close to the candlesticks, this signal could be indicative of a short-term correction rather than a long-term bearish trend. The juxtaposition of these indicators would suggest a cautious approach to trading this pair, with an emphasis on short-term strategies that can capitalize on potential breakouts or breakdowns signaled by the Bollinger Bands and Parabolic SAR.
• DISCLAIMER: Please note that the above analysis is not an investment suggestion by “Capitalcore Ltd”. This post has been published only for educational purposes.